Describe Image
May 29, 2024 2025-08-17 15:50Describe Image
Reading Time: 16 minutesPart 1: Speaking
DESCRIBE IMAGE
Made Easy
-
Preparation time: 25 seconds
-
Time to read the text aloud : 40 seconds
-
Number of these tasks: 5 - 6
Describe image tests your ability to describe the information in an image of a graph, chart, map, table or picture.
- You will see the image.
- After 25 seconds, you should give a spoken description of the information in the image.
- Your speaking skills are tested.
- The timer shows the time left for all tasks in this part of the test.
- The recording status box counts down from 25 seconds to zero.
- The recording status box changes to ‘Recording’. Start speaking when the bar begins moving. When the bar reaches the end (after 40 seconds), or when you’ve stopped speaking for three seconds, the microphone switches off and the recording status box changes to ‘Completed’.
- Click ‘Next’ to go to the next task.
- PTE Academic - Candidate Name
- Time Remaining 00:12:23
- 19 of 27 (126543.1)
Look at the graph below. In 25 seconds, please speak into the microphone and describe in detail what the graph is showing. You will have 40 seconds to give your response.
Describe Image Tests Only One Skill
-
Speakingup to 32 points
- Speaking under timed conditions
- Using supporting details (e.g. numbers) and explanations
- Organising a short oral presentation in a logical way
- Developing complex ideas within a short talk
- Using words and phrases appropriate to the context
- Using accurate grammar
- Speaking fluently at a natural speed
- Using clear pronunciation
- Using appropriate intonation, stress, rhythm and linking
- Using a tone appropriate to the reason for speaking (e.g. to inform or to explain)
Top Strategies for Success in Describe Image
- Before The Test
Practise organising your descriptions into a logical structure.
Introduction (what the image shows in general)
Features (in the order you see them)
The most significant feature
Introduction
Main point
Other details
An obvious conclusion (that can be drawn from the image)
Introduction
Comparisons and contrasts
Any unusual features
-
Practice TipsFollow To Succeed
◾ Find some graphs, charts, maps, plans or tables from books, newspapers, academic or government websites to practise with. Try to find a variety of examples of each type of image.
◾ Practise identifying and describing the most significant features of an image (e.g. the biggest change or the largest and smallest differences) and the relationships between them.
◾ Record yourself on your mobile phone or other device as you practise describing graphs, charts, etc. Listen afterwards to the organisation of your talk, and to your stress, intonation, rhythm and pronunciation. Start with untimed practice and later practise under timed conditions.
◾ Practise in an environment with other people talking around you – for example, with the TV / radio on or in a busy place with other people around. There are likely to be people talking at the same time as you in the PTE- A exam room.
◾ Practise drawing conclusions. For example, if the image shows that more people take trains than buses in a particular city, the conclusions at the end of your talk might be:
This suggests that the city’s train network might be more convenient for commuters than the bus network.
The conclusions should be logical and reasonable given the data.
◾ Practise giving implications. In the example above, you could say: If you visit this city, you’re more likely to travel by train than by bus.
◾ Practise intonation when describing images. Note that:
• the tone of voice usually falls at the end of each point.
• if two things are contrasted, the first point usually has rising intonation and the second usually has falling intonation. For example,
-
Language focus
Study a range of words, collocations and grammatical structures for describing different features of the various types of images, e.g.
• statistical vocabulary to describe trends (synonyms for increase, decrease, etc.);
• comparative and superlative structures for pie charts, line graphs with two or more lines, (e.g. far more than);
• directions and locations for maps;
• estimates of quantity (e.g. roughly, around, just below);
• other useful phrases: a significant percentage of, reached a peak of nearly 27.5 million in 2005, miles per hour, in comparison, 1997 saw a much smaller increase, a little to the north west of, etc.
- During The Test
BEFORE DESCRIBING THE IMAGE
Use the 25 seconds preparation time to analyse the image carefully.
• Take notes, using the erasable booklet and pen, if you have practised taking notes while doing these tasks and they help you speak. Only write key words, you won’t have time to write full sentences.
• Identify the general topic and type of information in the image. Check the title, the axes (for graphs and charts), the headings and sub-headings (for tables) or the labels (for maps and pictures).
• Check the units of measurement used (US dollars, kilograms, etc.) and the reference points (years, categories, etc.).
• Identify the important features and the relationships between them. If it is a graph, a chart or a table, look for a trend you can comment on. If it is a map, flow chart or picture, comment on the important features.
• Draw a conclusion or work out an implication.
• Think about how to describe it logically. For example, don’t plan to start on one side of the image and work your way to the other side – you may run out of time before you finish. It is more important to describe key parts than to describe everything you see.
• When the count down has nearly reached zero, take a deep breath so you’re ready to start speaking.
WHILE DESCRIBING THE IMAGE
When you hear the tone, start speaking straight away (the microphone switches off if you don’t say anything within three seconds).
Speak normally, clearly and naturally– not too quiet, too loud, too fast or too slow. This should be the same volume you used when checking your microphone at the beginning of the test.
Some people feel uncomfortable speaking just to the microphone, so imagine you’re speaking to a friendly audience.
Ignore others in the room. Don’t let their speaking distract you.
Pay careful attention to intonation, rhythm, pauses, etc.
FOLLOW A PLAN
• Describe the content of the image, e.g. The map shows …
• Summarise the most significant features with supporting details. For example, The highest temperature of 32 degrees was reached in the middle of summer, as seen in the graph in the month of July.
• Avoid repeating information.
• Pay attention to time and give your conclusion or implication before your 40 seconds of speaking time is finished.
Remember, What To Do What Not To Do In Describe Image
- You only pause briefly.
- You don’t pause for longer than three seconds. The microphone switches off after three seconds of silence.
- You focus on the most relevant information.
- You don’t try to give all the information you can think of. It will be too difficult and won’t help you achieve your goal.
- You build your response using the details in the image and the useful language you know for describing.
- You don’t give a response you memorised before the test as you may go off topic. You will get a very low score (or zero) for this.
- You use natural pronunciation. This leads to a better performance.
- You don’t exaggerate your pronunciation or intonation. Speak as naturally as possible.
- You only use the information provided, even if you know other things about the topic.
- You don’t use your own knowledge on a topic to describe the image.
- You try to talk about different parts of the image and vary how you are describing or comparing the information.
- You don’t repeat information.
Practice Now With Your Trainer
Practise Describe Image 2 here, if you want to try Read aloud without a time limit. Think about the strategies mentioned above. Then follow the task instructions and record your response on your mobile phone or other device.
- PTE Academic - Candidate Name
- Time Remaining 00:12:23
- 20 of 27 (126543.1)
Look at the graph below. In 25 seconds, please speak into the microphone and describe in detail what the graph is showing. You will have 40 seconds to give your response.
Reflecting on your practice
1. Play back and listen to your response. Use the checklist below to decide what you did well and what you need to practise more. Set aside time to work on each area that you want to improve.
- I identified the topic and the important features in the preparation time.
- I made a plan and followed it in my response.
- I described the main features of the image.
- I gave supporting details (e.g. numbers, facts).
- I spoke normally – not too loud, too quiet, too fast or too slow.
- I only included relevant information.
- I gave a conclusion or an implication.
- I used appropriate pronunciation.
- I didn’t pause too much and I didn’t miss out or repeat any words.
- I filled the time available and said everything I planned to say before the end.
2. Listen to a model answer for this task. Compare it to your own response. What are the differences? Are you happy with your response? What could you improve?
Common Mistakes Problems Errors In Describe Image
Points To Remember Speaking Tasks
Take time to get familiar with the mechanics of each speaking task and what happens on screen, as well as what you need to do or say. Managing the task itself can affect how successfully you complete it. Pay attention to when the computer will start recording and when you need to start speaking, as well as how much time you have for your responses.
Don’t click ‘Next’ too soon. Only move on to the next task when you are sure you are finished with the current one. You can’t go back to these tasks to try again.
Most Repeated Describe Image Questions in 2025
Quick Tips Strategies For Better Score!
When you look at the image ask yourself "What is the main idea being shown by the image?" and "What are the details relating to the main ideas?".
Use your erasable note-board booklet to note down key ideas and phrases that relate to the main information and the explanatory details. These can be put into sentences when you start to speak:

If you organize what you say, you will get a better score. This is because a well-organized answer is more likely to cover the main information as well as the additional details, and also talk about implications or conclusions based on the information.
Look at how this sample description is organized:

Your score on Describe Image is based on three factors:
Content: Does your response accurately and thoroughly describe the image?
Content is scored by determining if all aspects and elements of the image have been addressed in your response. Your description of relationships, possible developments and conclusions or implications based on details from the image is also scored. The best responses deal with all parts of the image, contain logical and specific information and include possible developments, conclusions or implications. Mentioning just a few disjointed ideas will negatively affect your score.
Oral fluency: Does your response demonstrate a smooth, effortless and natural rate of speech? Oral fluency is scored by determining if your rhythm, phrasing and stress are smooth. The best responses are spoken at a constant and natural rate of speech with appropriate phrasing. Hesitations, repetitions and false starts will negatively affect your score.
Pronunciation: Does your response demonstrate your ability to produce speech sounds in a similar way to most regular speakers of the language?
Pronunciation is scored by determining if your speech is easily understandable to most regular speakers of the language. The best responses contain vowels and consonants pronounced in a native-like way, and stress words and phrases correctly. Responses should also be immediately understandable to a regular speaker of the language.
PTE Academic recognizes regional and national varieties of English pronunciation to the degree that they are understandable to most regular speakers of the language.
Notes
• Partial credit scoring applies to Describe Image. No credit is given for no response or an irrelevant response. This question type affects the scoring of the following: speaking, oral fluency and pronunciation.
• Your listening and writing skills are not tested by this question type, and your reading skills are only used to read the instructions.
• For more information download the Score Guide.
Sample Answers & Feedback
- PTE Academic - Candidate Name
- Time Remaining 00:12:23
- 19 of 27 (126543.1)
Look at the text below. In 40 seconds, you must read this text aloud as naturally and clearly as possible. You have 40 seconds to read aloud.
English Speaker’s Response
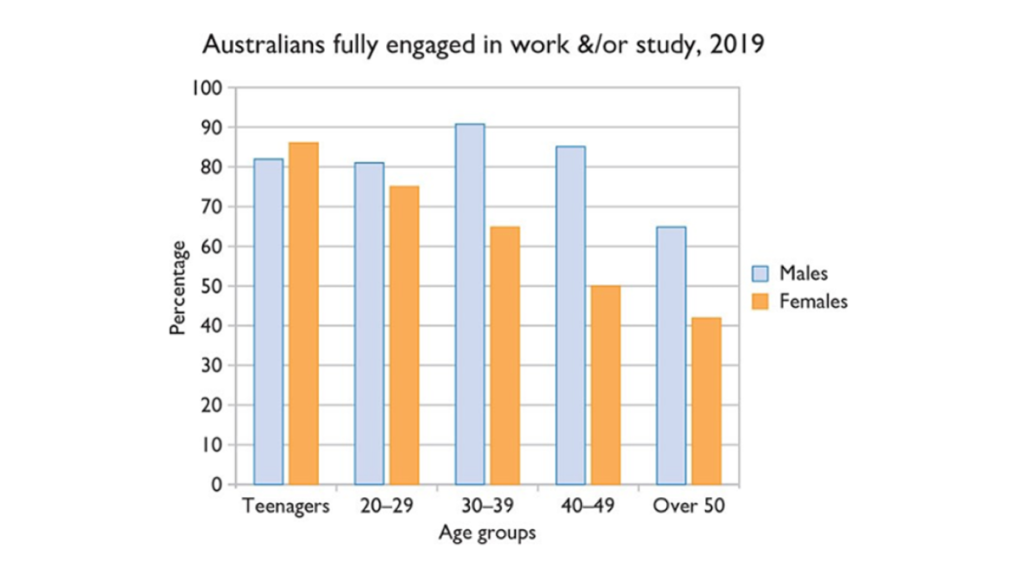
The graph shows the proportion of Australians working and/or studying for the year 2019. There was a higher percentage of males working or studying, compared to females for all age groups except for teenagers. After the age of 20, males surpassed females in terms of the percentage of those engaged in work or study. Between the ages of 30 and 39, their rate of employment increased at around 90 percent. The percentage of females working continued to steadily decline, falling to just over 40 percent in the oldest age group, the over 50s.
Listen to the three sample answers for this task. Each recording provides an example of a response given by test takers at a C1, B2 or B1 competence level.
Sample Answer: 1 C - 1
The graph shows percentages of Australian men and women working or studying full time in 2019. The largest percentage of women, around 85 percent, were working or studying full time when they were teenagers. After the age of 20, a higher percentage of men are engaged in work or study than women. The age group of 30 to 39-yearold men featured the highest rate in full-time employment or education, with around 90 percent. Other age groups were nearly as high, except for the over-50s – around 65 percent of men in this age group had jobs or were studying.
Feedback:
This is a very good response in terms of content and language use. The key aspects of the bar chart and the relationships between its elements are accurately described. However, the test taker does not mention how the situation develops for Australian women across the different age groups. The language used is appropriate and varied. The speech has acceptable rhythm with natural phrasing, which refers to the grouping of words. Emphasis is placed correctly throughout and helps the listener to understand the information. The description is clear and can be understood easily.
Sample Answer: 1 B - 2
The graph shows Australians fully engaged in work and/or study. The graph is from 2019, females are orange and males are blue. The percentage of females get smaller from teenagers to over fi fty age group – from 85 percent down to 41 percent Males are highest in age group 30–39 with 90 percent.
Feedback:
This is a good response. The test taker is able to include most key aspects and make the relationship between them clear, but does not include trends, such as the steady decline of women in full-time employment or education. The test taker does not mention details relating to women over 29 years.
Overall, the response lacks the descriptive language needed for a clear description of the bar chart. It is, however, spoken with acceptable speed. There are minor hesitations when the test taker supports her description with details such as percentages or age brackets. Pronunciation is good, although clearly non-native.
Sample Answer: 1 B - 1
The graph shows percentages of Australian men and women working or studying full time in 2019. The largest percentage of women, around 85 percent, were working or studying full time when they were teenagers. After the age of 20, a higher percentage of men are engaged in work or study than women. The age group of 30 to 39-yearold men featured the highest rate in full-time employment or education, with around 90 percent. Other age groups were nearly as high, except for the over-50s – around 65 percent of men in this age group had jobs or were studying.
Feedback:
The response is fairly good. The information given is largely limited to words and figures that appear on the chart. There is no discussion of the relationships between the different elements of the chart, although the downward trend for women’s involvement in employment and/or work is hinted at. The response shows grammar and vocabulary errors. The test taker’s speech seems uneven and percentage as well as percent are mispronounced.
Describe Image Task Worksheet
In this worksheet, you are going to focus on how to get ready for the Describe image task. You will look at how to structure your answer, explore some useful language for the task, practise delivering a response within the time limit and be aware of intonation in your delivery.
1. Before and during the test, you may face some challenges. Look at the list of possible issues (1–4) and match them with the strategies you can use to overcome them (a–d).
1. You can hear other people.
2. You are worried about the time limit.
3. You think your voice might be too quiet.
4. You think the image might be difficult.
a. Check the microphone is at the right volume.
b. Practise speaking in a noisy room.
c. Time yourself every time you practise.
d. Practise describing different types of image.
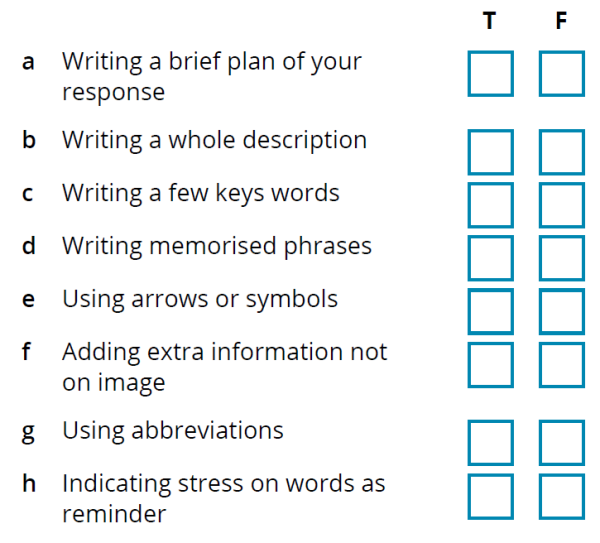
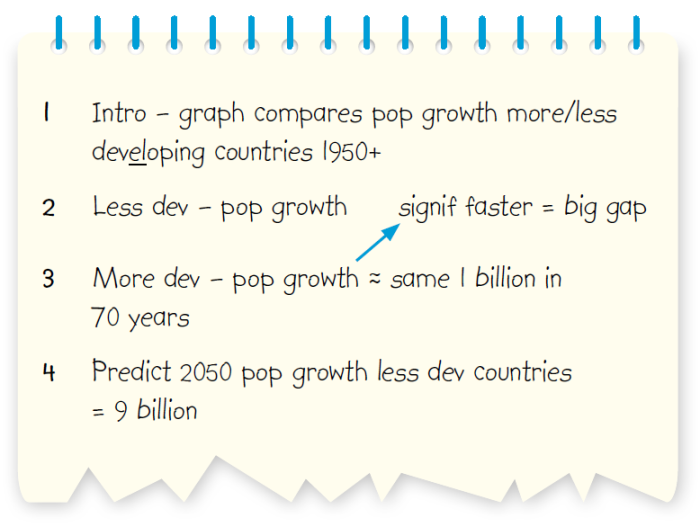
2. You can make notes during this task if you want to. Look at the graph. Then read the notes that a test taker has made. Tick (✅) the note-taking strategies the test taker has used.
3. For the Describe image task, you will have twenty-five seconds to prepare your response. Put steps a – d in the order you should do them during your preparation time.
a. Look at the measurements used in the image _______________________
b. Draw a conclusion _______________________
c. Identify the general topic of the image _______________________
d. Identify key information _______________________
4.1. You have only forty seconds to give your response, so it is impossible to cover all the information given in the image. You need to decide what the most important features of the image are, for example, trends and relationships, significant facts and figures.
Look at the graph and notes in Exercise 2 again and answer the questions.
1. What information has the test taker focused on?
2. Which figures has the test taker mentioned?
3. What trends and relationships has the test taker highlighted?
4. What dates has the test taker referred to?
4.2. Record your own description of the image in Exercise 2. Use the notes if you want to. Make sure you time yourself. Did you complete your response in forty seconds? If not, did you include less important information?
Try to have a structure when you are describing the image. It will make more sense to the listener if you have clear sections in your description and they will be able to follow it more easily.
5.1. Read the test taker’s response based on their notes and the graph in Exercise 2. Match sentences 1–4 with purposes a–d.
¹ The graph shows the population growth in more developed and less developed countries since 1950. ² Population growth in less developed countries has risen significantly over the last seventy years and is continuing to rise. ³ In contrast, population growth in more developed countries has remained roughly at the same level of around one billion people. ⁴ The gap between less developed and more developed countries is widening and the prediction is that by 2050, the population in less developed countries will have reached nine billion.
a. a conclusion _______________________
b. an overview _______________________
c. significant information _______________________
d. contrasting information _______________________
5.2. Time yourself reading the description in Exercise 5.1. Can you do it in forty seconds?
When you explain quantities in images, it’s sometimes preferable not to give exact amounts. We can use words such as roughly, around, approximately, almost, just under and just over.
6. Use words from the tip to describe quantities 1–4.
1. 69.7%
2. 1,000,653
3. 147,345
4. $9.75
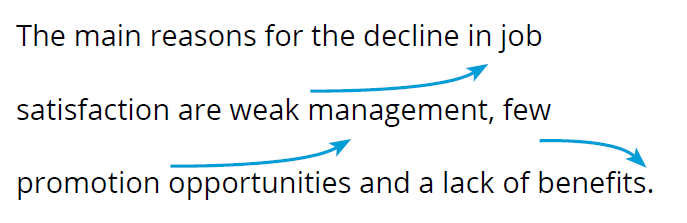
Intonation is important when you are describing images. Intonation usually falls at the end of each point. If you contrast two things, the first usually has rising intonation and the second has falling intonation. In a list, each item has rising intonation except the last, which has falling intonation, for example:
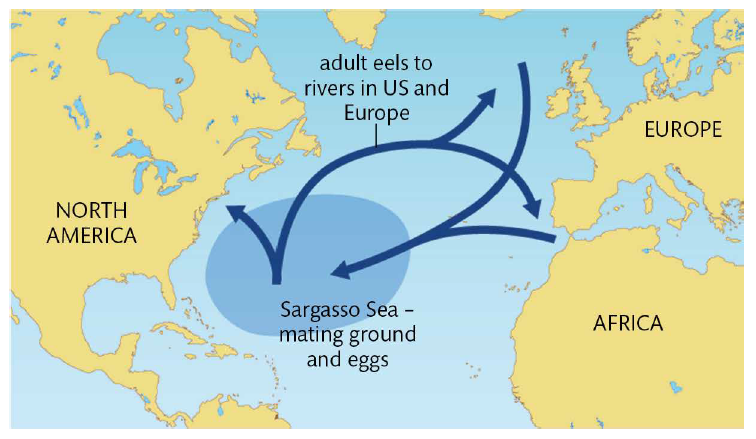
7.1. Read the Describe image response and draw arrows to show where the intonation rises and falls.
The image shows the migration of eels. Young eels are born in the Sargasso Sea, which is situated between North America, Europe and Africa. When they are adults, there is a migration to rivers in North America. Some eels travel a greater distance, heading eastwards to the rivers of northern and southern Europe. Adult eels then migrate from these regions back to the Sargasso Sea to mate and lay eggs.
7.2. Practise describing the image, focusing on intonation. Record yourself and check that your intonation sounds natural. Remember that you have only forty seconds to deliver your response.
8. Listen to a test taker’s description of the image in Exercise 2. Use the checklist to assess their performance. Tick (✅) the things they did well.
- 1. Covered the main points
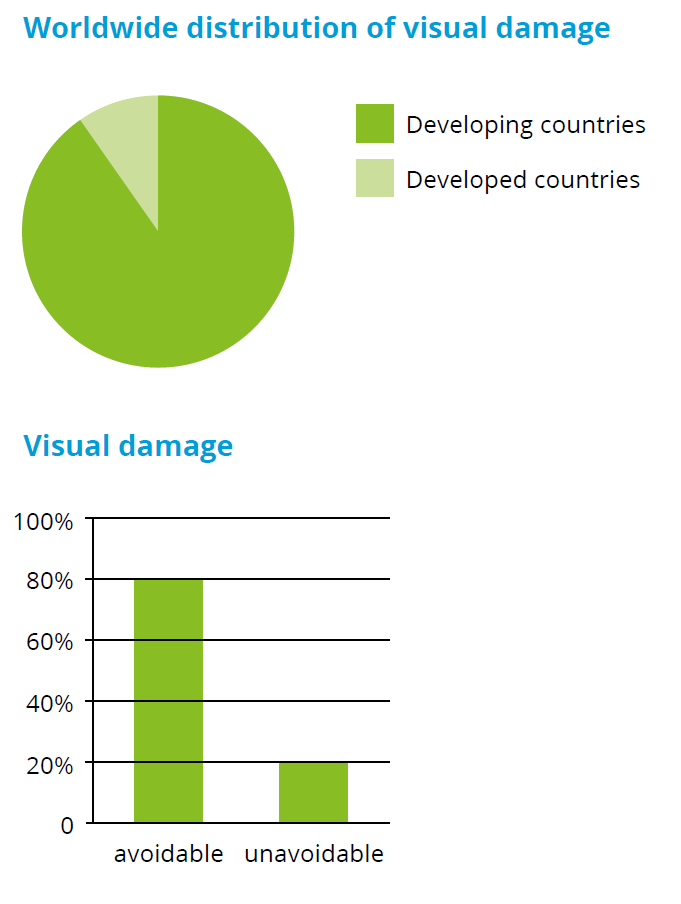
- 2. Included all important details
- 3. Spoke without repetition
- 4. Spoke at a suitable speed
- 6. Spoke without hesitation
- 7. Had reasonable intonation
- 8. Had reasonable intonation
- 9. Stayed within the time limit
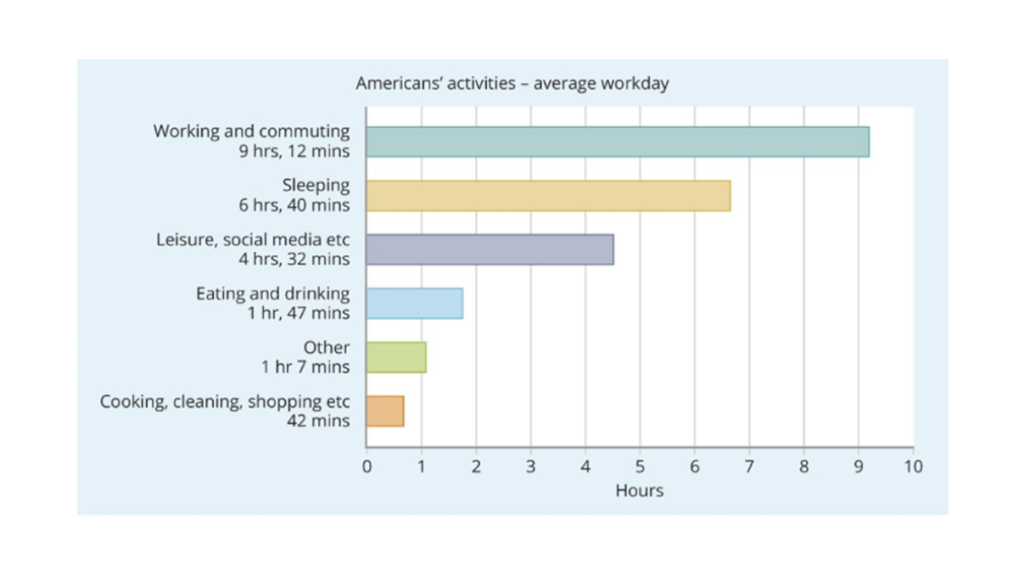
9. Look at the chart and the graph. You have twenty-five seconds to make some notes. Use the strategies in Exercise 2. Then record your response. Remember you must not speak for more than forty seconds. Listen to your recording and use the checklist in Exercise 8 to assess your performance. Find other images and repeat the process.